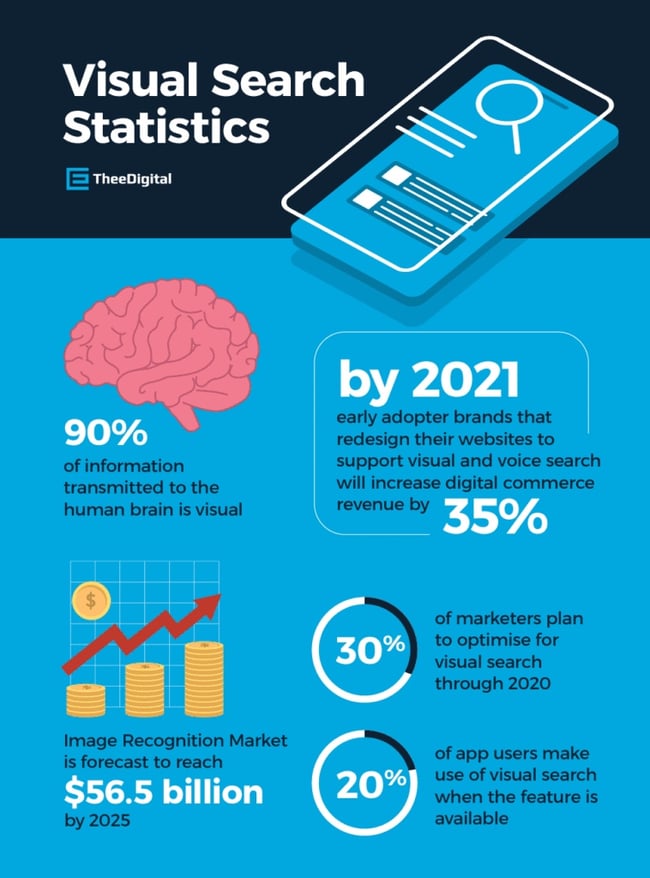
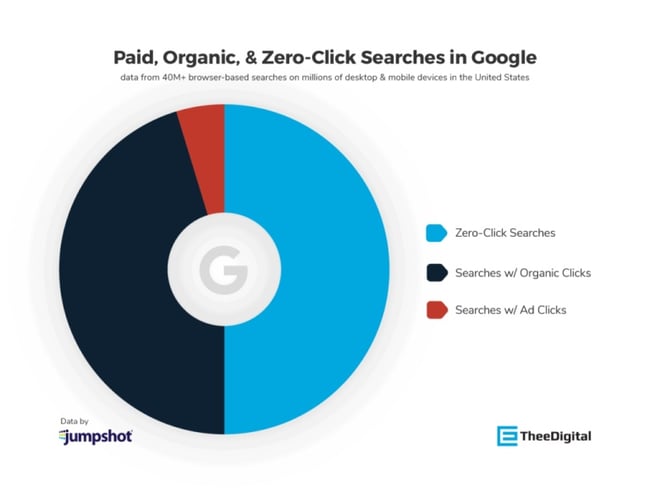
Search Data from Digital Marketing Trends Source: TheeDigital


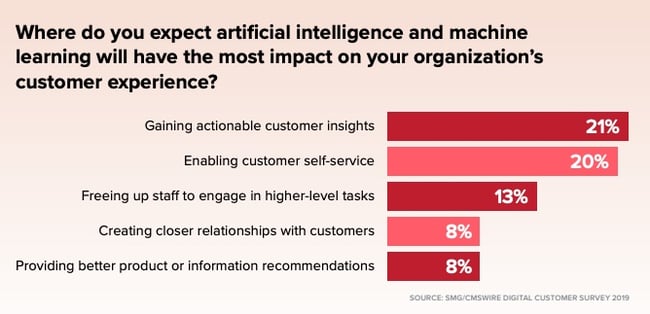
AI/Machine Learning
Customer Journey
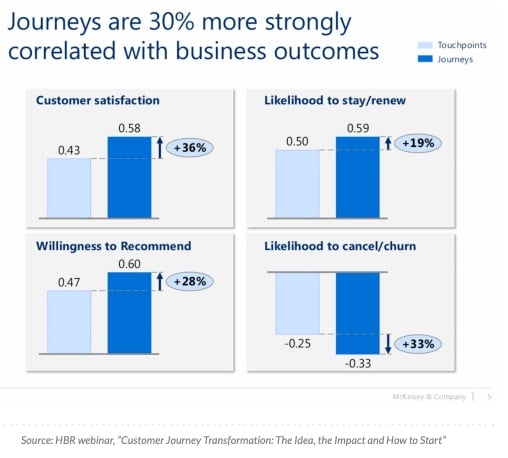
Found this in a great ebook from Pointillist: Customer Journey 101
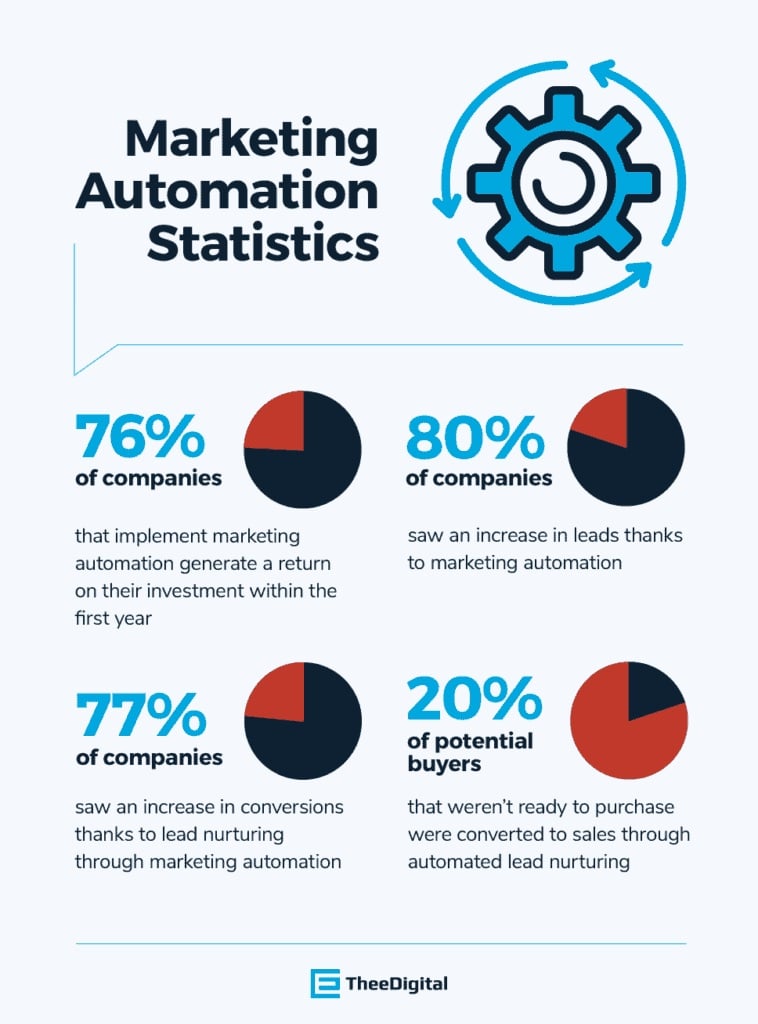
Marketing Automation
StackMates
See the products that sit alongside the industry’s leading marketing automation platforms. Data comes from the hundreds of stacks being managed on the CabinetM platform. Check out the StackMates reports here.
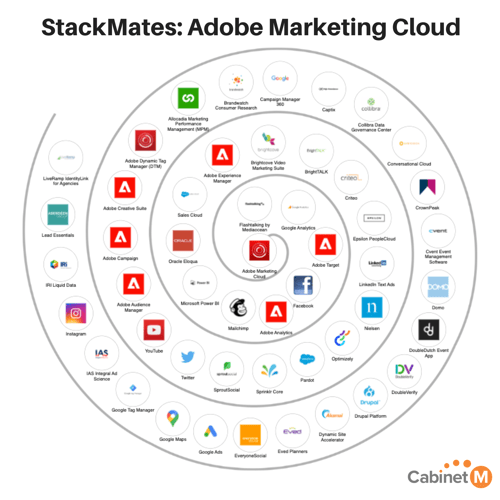
Marketing Automation: Adobe Marketing Cloud – Source: CabinetM
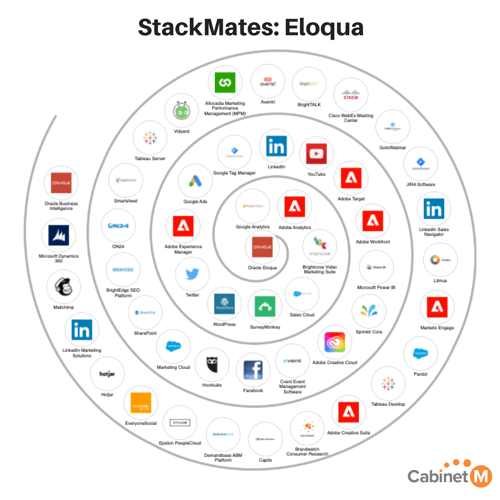
Marketing Automation: Eloqua – Source: CabinetM
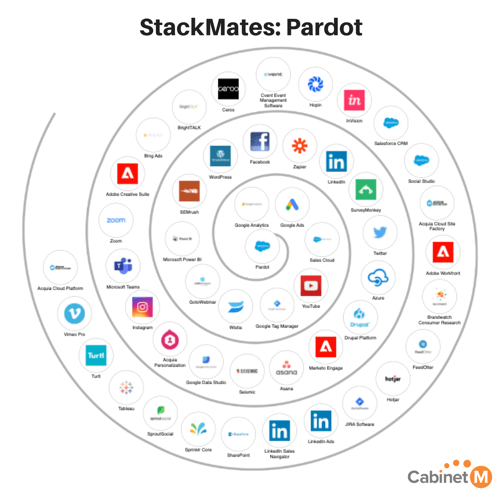
Marketing Automation: Pardot – Source: CabinetM
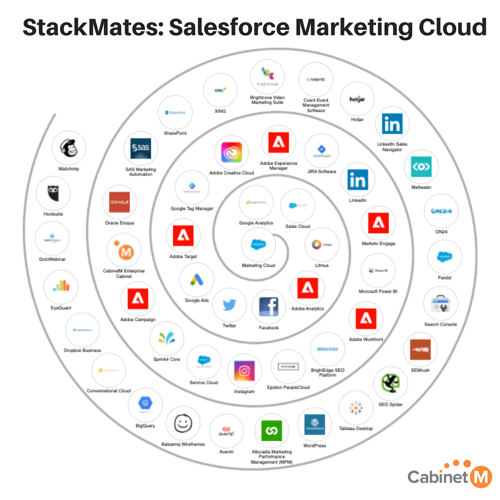
Marketing Automation: Salesforce Marketing Cloud – Source: CabinetM
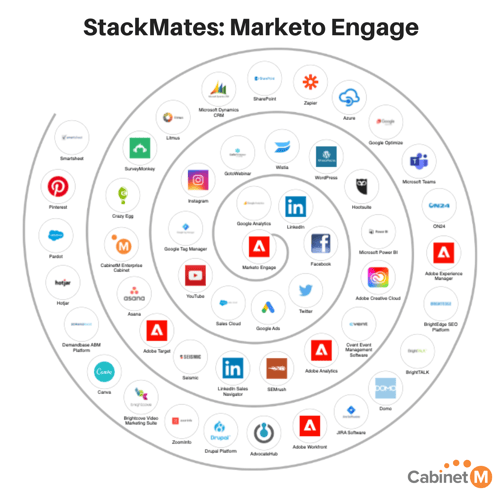
Marketing Automation: Marketo Engage – Source: CabinetM
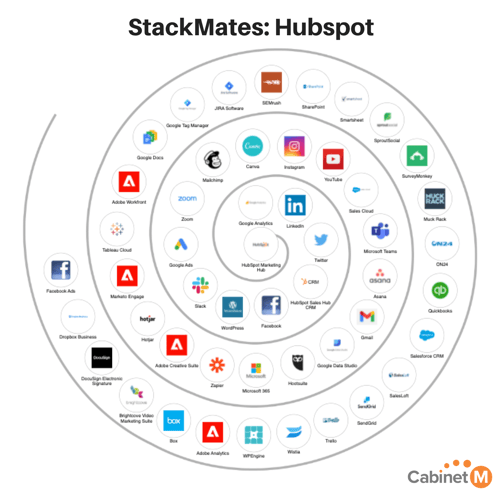
Marketing Automation: Hubpot – Source: CabinetM
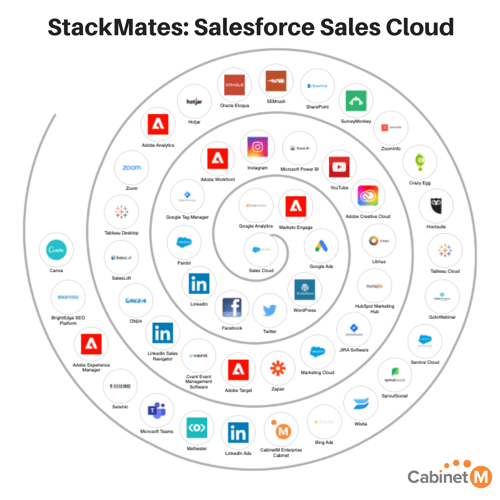
Marketing Automation: Salesforce Sales Cloud – Source: CabinetM
Search
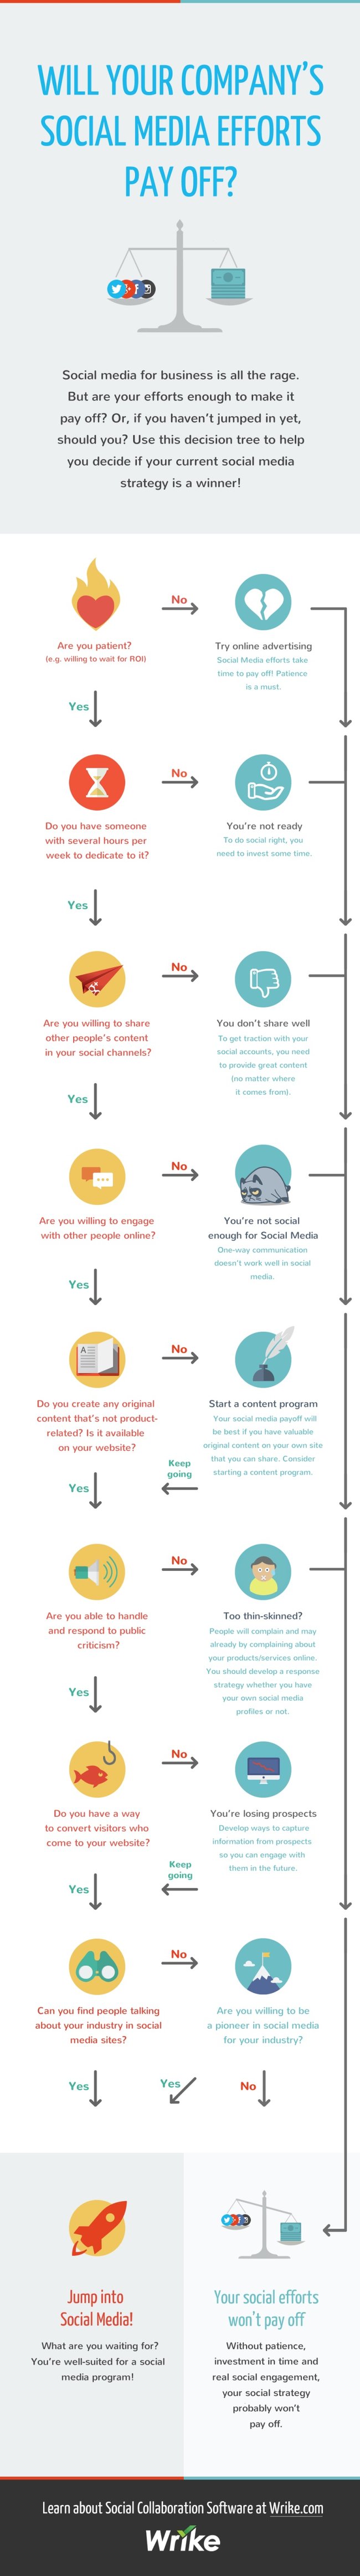
Social Media

300 Stats to Build Your MarTech Case: Source Martech Tribe
.png "Screenshot (97)")
Source: Okta’s 2024 Businesses at Work Industry Trend Report

Digital Advertising Spend

Change in Investments for Digital Channels: Source Gartner

Source: McKinsey

Gartner Hype Cycle for Digital Marketing
.png "Screenshot (98)")
Marketing Metrics for Website Tracking
.png "Screenshot (99)")
Mobile Advertising Statistics: Source statista.com

Source: The Dividends of Digital Marketing Maturity, Boston Consulting Group

B2B Generative AI Usage

EMarketer US Retail Ecommerce Sales

Evolving Priproties of Tech Marketing Leaders
.png "Screenshot (100)")
How Marketing Budgets Were Spent in 2023

Top Digital Marketing Channels for 2024

Marketing Budgets in 2024

B2B use of Organic Social Media Platforms
.png "Screenshot (101)")
MarTech Strategies in Education: Source Medium
